Interested in tax statistics? We’ve got you covered.
As Accountants we’re renowned for liking numbers. So, what better way to feed our addiction than by looking at how us, as Australians pay tax. The Australian Bureau of Statistics has recently released the information for the 2018 financial showing the amount each level of government earns in taxes.
Taxation Revenue by Level of Government
A feature of the Australian federal system is that the Commonwealth Government levies and collects all income tax, from individuals as well as from enterprises. It also collects a portion of other taxes, including taxes on the provision of goods and services. The revenue base of state governments consists of taxes on property, on employers’ payroll, and on the provision and use of goods and services. The sole source of taxation revenue for local governments is taxes on property.
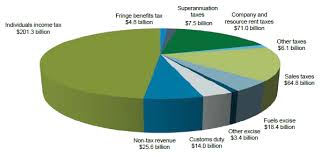
Total taxation revenue collected in Australia increased $41,797m (8.6%) from $486,790m in 2016-17 to $528,587m in 2017-18. This was driven by a $31,332m (11.1%) increase in taxes on income, profits and capital gains, and a $6,244m (4.6%) increase in taxes on provision of goods and services.
The table below compares taxes received by all levels of government
|
TOTAL TAXATION REVENUE, By Level of Government and Category
|
||||||
|
2012–13
|
2013–14
|
2014–15
|
2015–16
|
2016–17
|
2017–18
|
|
|
$m
|
$m
|
$m
|
$m
|
$m
|
$m
|
|
|
COMMONWEALTH GOVERNMENT |
||||||
| Taxes on income, profits and capital gains |
241 797
|
248 435
|
258 610
|
265 116
|
281 157
|
312 474
|
| Taxes on employers’ payroll and labour force |
646
|
844
|
735
|
670
|
605
|
1 107
|
| Taxes on property |
–
|
–
|
–
|
–
|
–
|
–
|
| Taxes on provision of goods and services |
84 725
|
90 377
|
92 225
|
97 181
|
99 913
|
106 492
|
| Taxes on use of goods and performance of activities |
10 170
|
10 574
|
3 661
|
6 289
|
6 900
|
7 163
|
| Total taxation revenue |
337 338
|
350 230
|
355 232
|
369 257
|
388 576
|
427 237
|
|
STATE GOVERNMENT |
||||||
| Taxes on income, profits and capital gains |
–
|
–
|
–
|
–
|
–
|
–
|
| Taxes on employers’ payroll and labour force |
20 786
|
21 366
|
22 041
|
22 684
|
23 194
|
24 413
|
| Taxes on property |
7 779
|
8 733
|
9 283
|
10 029
|
11 346
|
12 222
|
| Taxes on provision of goods and services |
25 406
|
28 296
|
31 625
|
34 416
|
35 373
|
35 038
|
| Taxes on use of goods and performance of activities |
9 745
|
10 103
|
10 817
|
11 524
|
11 875
|
12 588
|
| Total taxation revenue |
63 715
|
68 498
|
73 766
|
78 653
|
81 787
|
84 261
|
|
LOCAL GOVERNMENT |
||||||
| Taxes on income, profits and capital gains |
–
|
–
|
–
|
–
|
–
|
–
|
| Taxes on employers’ payroll and labour force |
–
|
–
|
–
|
–
|
–
|
–
|
| Taxes on property |
14 027
|
14 870
|
15 779
|
16 620
|
17 399
|
18 122
|
| Taxes on provision of goods and services |
–
|
–
|
–
|
–
|
–
|
–
|
| Taxes on use of goods and performance of activities |
–
|
–
|
–
|
–
|
–
|
–
|
| Total taxation revenue |
14 027
|
14 870
|
15 779
|
16 620
|
17 399
|
18 122
|
|
ALL LEVELS OF GOVERNMENT |
||||||
| Taxes on income, profits and capital gains |
241 802
|
248 425
|
258 605
|
265 111
|
281 141
|
312 473
|
| Taxes on employers’ payroll and labour force |
20 763
|
21 508
|
22 032
|
22 590
|
23 003
|
24 680
|
| Taxes on property |
21 774
|
23 560
|
25 016
|
26 602
|
28 693
|
30 289
|
| Taxes on provision of goods and services |
110 131
|
118 673
|
123 850
|
131 596
|
135 286
|
141 530
|
| Taxes on use of goods and performance of activities |
19 838
|
20 590
|
14 413
|
17 737
|
18 666
|
19 616
|
| Total taxation revenue |
414 308
|
432 757
|
443 916
|
463 636
|
486 790
|
528 587
|
| -(courtesy www.abs.gov.au) | ||||||
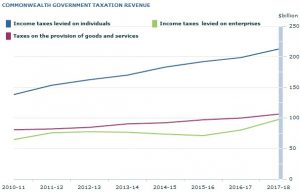
Commonwealth Government taxation revenue increased $38,661m (9.9%) from $388,576m in 2016-17 to $427,237m in 2017-18. This was driven by a $31,317m (11.1%) increase in taxes on income, profits and capital gains, and a $6,579m (6.6%) increase in taxes on provision of goods and services. The following graph shows the level of taxation revenue for the three main sources of taxation revenue for the Commonwealth Government.
(courtesy www.abs.gov.au)
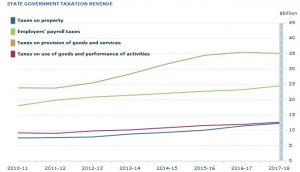
State government taxation revenue increased $2,474m (3.0%) from $81,787m in 2016-17 to $84,261m in 2017-18. This was driven by a $1,219m (5.3%) increase in taxes on employers’ payroll and labour force, and a $876m (7.7%) increase in taxes on property. The following graph shows the level of taxation revenue for state governments by source.
(courtesy www.abs.gov.au)
As the above graphs demonstrate, the amount of income generated by the various taxes across all levels of government has been progressively increasing over the years. There are many reasons why these levels have increased, not the least being the increase in the population.
Author
Kim Jay